Air start conditions

Altitude
m
Unit system (reset)


°C
% RH

Air flow
m³/h

Sensible Heat Factor

Factor

Coil Performance
Value
%
kW

Moisture recovery
Value
%
kW

Coil Performance
Value
%
kW

Moisture recovery
Value
%
kW

Coil Performance
Value
%
kW

Moisture recovery
Value
%
kW

Coil Performance
Value
%
kW

Moisture recovery
Value
%
kW


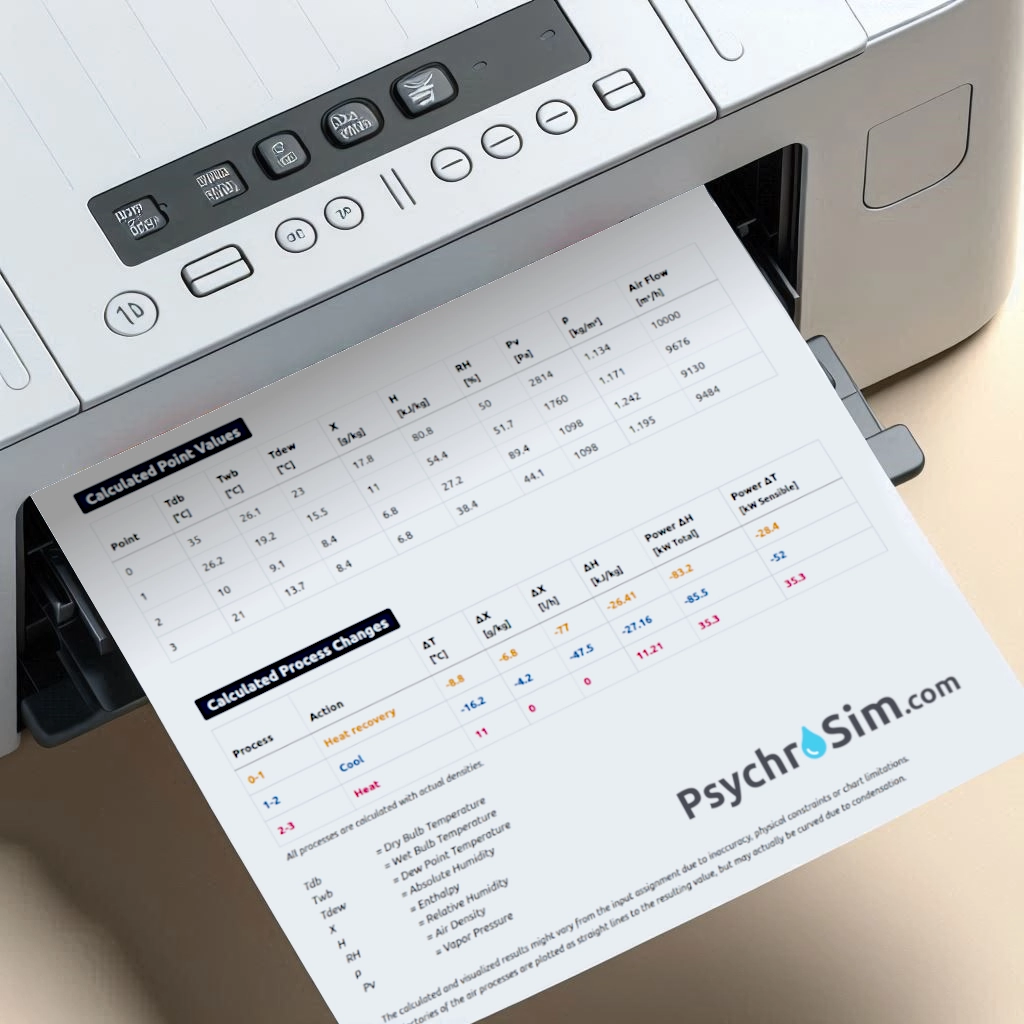
Point Values


Process Changes

All processes are calculated with: and .

Tdb
= Dry Bulb Temperature
X
= Absolute Humidity
H
= Enthalpy
RH
= Relative Humidity
ρ
= Air Density
Pv
= Vapor Pressure
Tdew
= Dew point Temperature
Twb
= Wet bulb Temperature


About

Online Mollier-Diagram

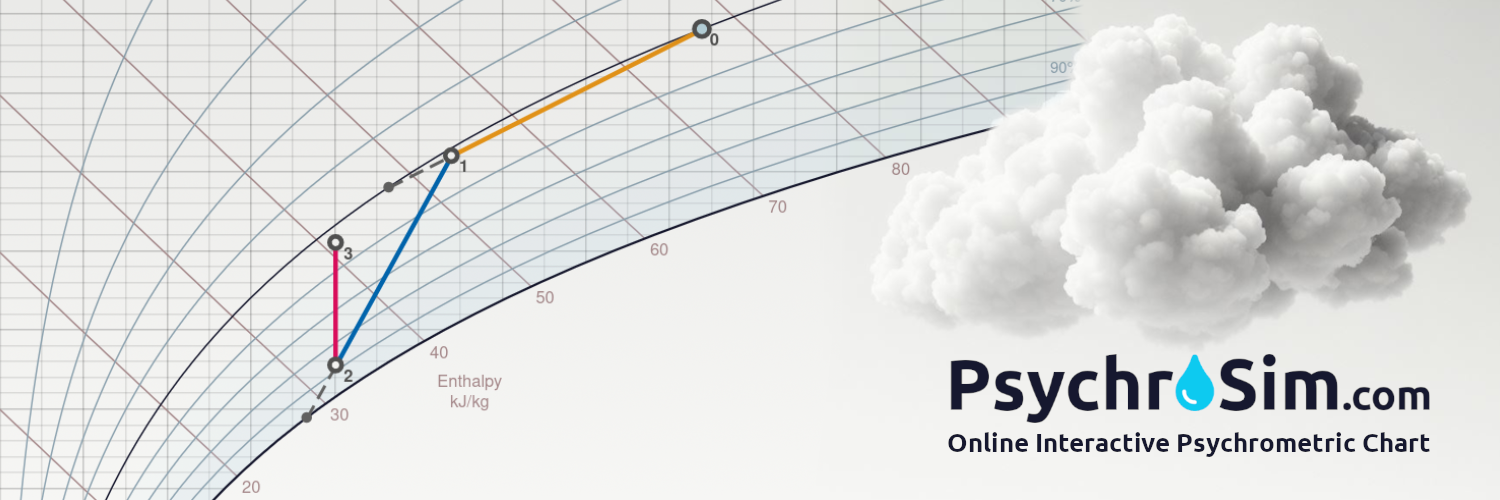
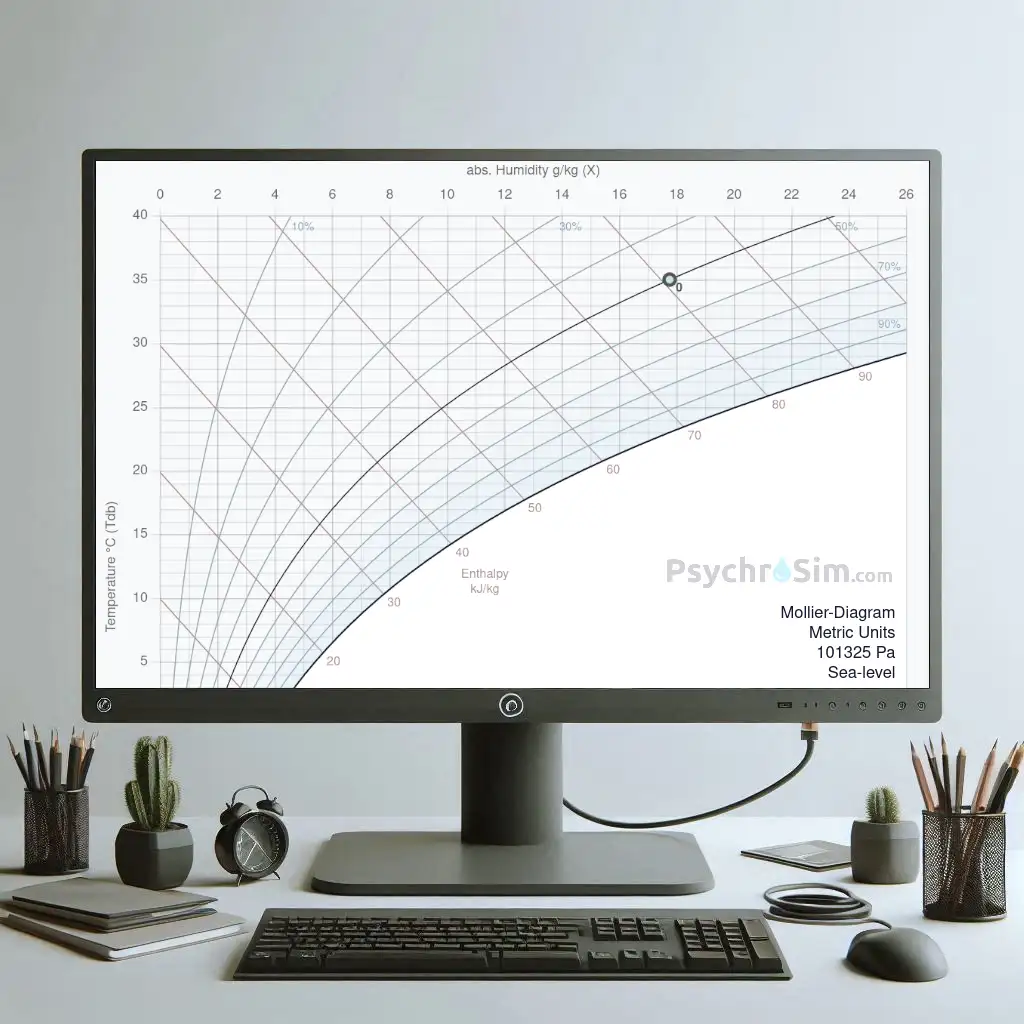
With a Mollier Diagram (also know as Psychrometric Chart) you can draw processes of humid (moist) air and calculate air conditions. This diagram is widely used in mechanical engineering and HVAC technology and plots the Temperature versus the Absolute Humidity. The chart is is combined with the Relative Humidity lines and the Enthalpy to calculate the change in total internal energy.
The Psychrometric Chart is also known as the "Mollier-Diagram". At the Thermodynamics Conference in Los Angeles (1923), it was decided to name the diagram after Richard Mollier in his honor.

Psychrometric Chart calculator and Sketcher

With this online tool you can simulate and visualize thermodynamic processes that affect moist air.
After entering the Air start conditions, you can enter various actions, like "Mix", "Heat", "Cool", "Heat Recovery" and "Humidify".
The new condition of the air is calculated and this new point and the process will be automatically drawn in the diagram.

Customizations

Set the chart according to your needs:
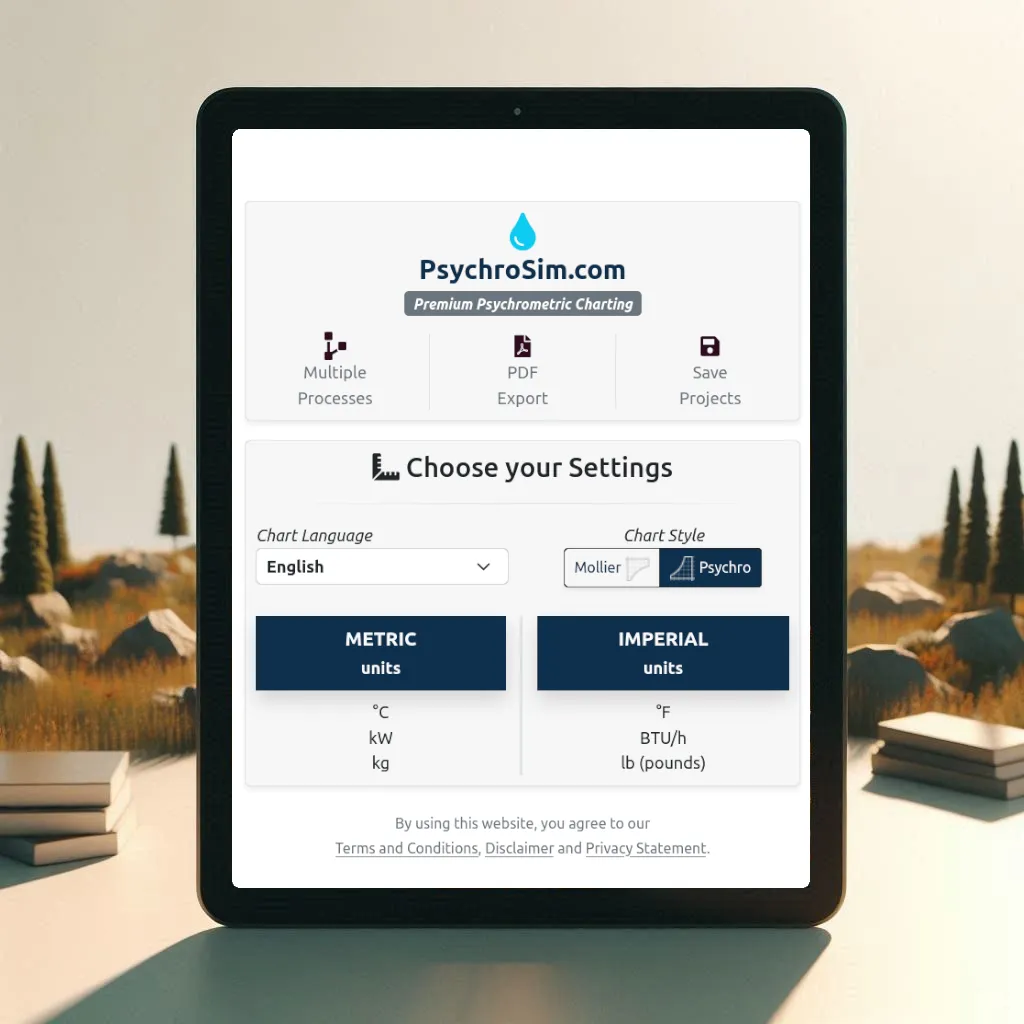
  • Chart Style: Mollier/ Psychrometric-Chart. The x/y-axes will be flipped
  • Units-system can be set to Metric(SI) or Imperial(I-P). This affects the chart, input values and calculated values.
  • Altitude: Standard the altitude is set to sea level. Because the formulas and the graph depend on the height above sea level (air pressure changes), it is important set the correct altitude.
  • Axes: Do you want to focus on just a part of the diagram?
  • Comfort area: This is the range of the desired Temperature and Humidity. On/Off or customizable.

PDF report

If you want to save your Diagram and Values/ processes in a PDF-report, please push the button "Save PDF", and it starts downloading automatically.